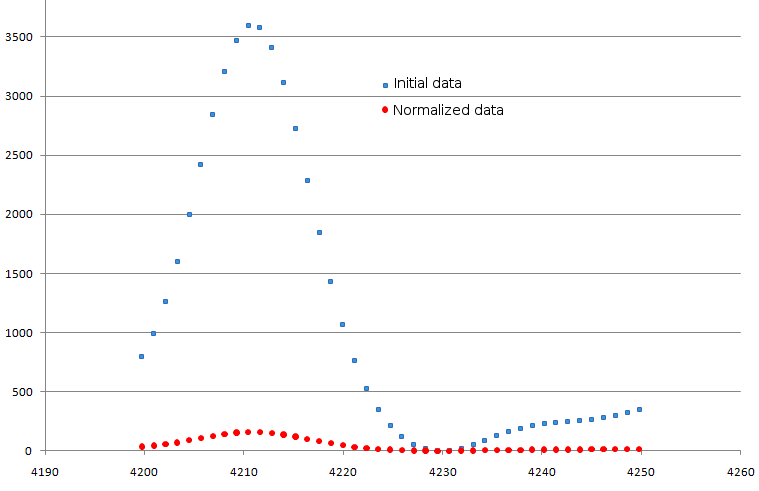
Figure 1. Result of normalization procedure. Original data are shown as blue squares, modified ones - as red circles.
Normalization allows to bring peaks intensity values to a common scale, and thus it becomes possible to compare data from different spectra. The only parameter for current procedure is 'NormalizationConstant' (default value is 10000).
Figure 1. Result of normalization procedure. Original data are shown as blue squares, modified ones - as red circles.
Input: m/z - Intensity data
Output: Normalized m/z - Intensity data in the same format as input data.
Parameter(s):
NormalizationConstant - This parameter specify the normalization constant. The default value is 10000.
File format type - This parameter specify file format. SSV-space separated values, CSV - comma separated values, TSV - tab separated values.
Data format.
Mass spectra data represent the sets of following pairs of values: mass to charge relation
(m/z, further, for more convenience, it will be referred to as m, mass) and corresponding signal intensity (I).
On a spectrum plot, the mass corresponds to X coordinate, and signal intensity- to Y one.
A typical spectrum consists of several thousand of such value pairs (points). Data are represented as
text files, where for each pair (mi,Ii) of mass-intensity values the string is assigned, and data in
this string are separated by special separator symbol. The SMS package allows several separators types:
space (SSV, space separated values, file format), comma (CSV, comma separated values, file format) and
tabulation (TSV, tab-separated values, file format). In files with data, the string with comments are
allowed; during the file reading these strings are to be skipped. The commentary strings should begin
with "#" symbol at the first position. In the figure 2 the example of file with data in CSV format is shown.
#M/Z,Intensity
-7.8602611e-005,4.1126194
2.1773576e-007,4.0764203
9.6021472e-005,4.0040221
0.00036601382,4.1186526
0.00081019477,4.0040221
0.0014285643,3.9617898
….
19742.941,4.077895
19745.564,4.0772248
19748.187,4.0772248
Figure 2. Example file with mass spectra data in CSV format.