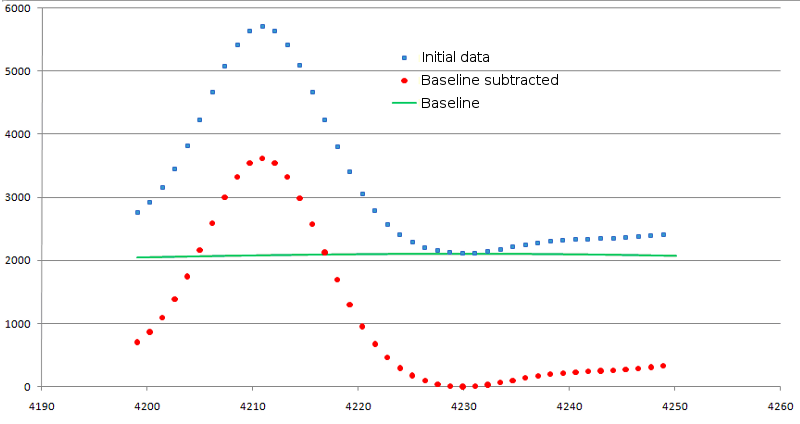
Figure 1. Result of background signal subtraction. Original data are shown as blue squares, modified ones - as red circles. Baseline is shown in green line.
This step of data processing is applied for elimination of the systematic artifacts that occur due
to matrix and chemicals used in the experiments or as a result of detector overload. It results in
background noise that may occur to be significant for some m values. The initial step in background
noise removal is identification of peaks (local signal maxima that are located far enough from each other).
The distance between peaks is determined by the 'Baseline parameter' value (default= 0.005). This parameter
defines the minimal m distance, over which the two neighboring peaks 1 and 2 are to be located in the way, when:
|m1-m2|/m1 > 'Baseline parameter'.
After peaks identification, algorithm detects the points with signal minima located in intervals between peaks. These are the base points for calculation of background noise line. Over base points the baseline for all spectrum points is built by interpolation. In case when in some spectrum parts the value of base signal exceeds the original one, the new base points selection from neighboring ones occurs.
The values of base signal intensity are subtracted from the original one. At that, if value of original signal has occurred below zero, it is equated to zero. The result of background subtraction is shown in figure 1.
Figure 1. Result of background signal subtraction. Original data are shown as blue squares, modified ones - as red circles. Baseline is shown in green line.
Input: m/z - Intensity data
Output: m/z - Intensity data after baseline subtraction in the same format as input data.
Parameter(s):
Baseline parameter - This parameter specify the minimal mass difference, over which the two neighboring peaks 1 and 2 are to be distinguished for baseline determination. The default value is 0.005.
File format type - This parameter specify file format. SSV-space separated values, CSV - comma separated values, TSV - tab separated values.
Data format.
Mass spectra data represent the sets of following pairs of values: mass to charge relation
(m/z, further, for more convenience, it will be referred to as m, mass) and corresponding signal intensity (I).
On a spectrum plot, the mass corresponds to X coordinate, and signal intensity- to Y one.
A typical spectrum consists of several thousand of such value pairs (points). Data are represented as
text files, where for each pair (mi,Ii) of mass-intensity values the string is assigned, and data in
this string are separated by special separator symbol. The SMS package allows several separators types:
space (SSV, space separated values, file format), comma (CSV, comma separated values, file format) and
tabulation (TSV, tab-separated values, file format). In files with data, the string with comments are
allowed; during the file reading these strings are to be skipped. The commentary strings should begin
with "#" symbol at the first position. In the figure 2 the example of file with data in CSV format is shown.
#M/Z,Intensity
-7.8602611e-005,4.1126194
2.1773576e-007,4.0764203
9.6021472e-005,4.0040221
0.00036601382,4.1186526
0.00081019477,4.0040221
0.0014285643,3.9617898
….
19742.941,4.077895
19745.564,4.0772248
19748.187,4.0772248
Figure 2. Example file with mass spectra data in CSV format.